 Back to Blog
Simple moving averages (SMA) and exponential moving averages (EMA) are technical indicators used in market analysis, helping traders gain a better understanding of trends. They work by smoothing out price bars, giving an average over a predefined time period, so traders have a clearer overview of what is happening in the markets. Rather than predicting new trends, they tend to be used to confirm them – if price bars move in the same direction as their moving average, they are easier to verify.
Moving averages use previous price data, so they lag behind current trends. For this reason, they are often used alongside other technical indicators, underpinning them to provide a more in-depth analysis. The data sets that are used to form the average are continuously replaced by new data, which is why it’s called a moving average.
The main practical difference between a simple moving average and an exponential moving average is the calculation that is performed. SMA are the most commonly used averages, but there are cases where EMA might be more appropriate. Due to the way they’re calculated, EMA give more weighting to recent prices, which can potentially make them more relevant. Traders with a short-term perspective will usually get similar results with whichever average they use, whereas traders with a long-term perspective need to carefully determine what they need their indicators to show them. There will be a distinct difference between SMA and EMA over a longer time period.
Simple moving average
Simple moving averages, or SMA, are generally the choice of the longer-term trader. If you are trading Event contracts with longer time frames, or week-long knock-outs/call spread contracts, you may choose to use this average. It will show you an average of price action over a set period of time.
How to calculate SMA
An SMA is exactly what the name implies: it’s the average of a set number of inputs, as chosen by the trader. In the instance of an SMA, these inputs will be closing prices. If, for example, you have ten price inputs (i.e. closing prices from the last ten days), you would add these together and divide the total by ten.
Exponential moving average (EMA)
Exponential moving averages, or EMA, give more weighting to recent prices. They reduce the effect of the lag that comes from using previous price data and can help you identify a trend earlier, so it’s a useful indicator for trading short-term contracts. An EMA’s main benefit is the speed with which it reacts to the markets, but it requires some caution too – it might look like a trend is forming, when actually it’s just a price spike.
To illustrate the emphasis placed on newer data, the below table shows the percentage of the EMA that is made up by each of the price bars. 10 price bars are used for this particular example.
| Bar | Exponential moving average | Simple moving average |
| 1 | 3.0% | 10% |
| 2 | 3.7% | 10% |
| 3 | 4.5% | 10% |
| 4 | 5.5% | 10% |
| 5 | 6.7% | 10% |
| 6 | 8.1% | 10% |
| 7 | 10% | 10% |
| 8 | 12.2% | 10% |
| 9 | 14.9% | 10% |
| 10 | 18.2% | 10% |
As you can see, the most recent price bar, number 10, accounts for 18.2% of the average. The oldest price bar, number 1, only accounts for 3%.
How to calculate EMA
To work out an EMA, you start with the SMA data. A multiplier is then added that increases the weighting of the newer price data.
This is the formula for working out the multiplier, which can then be used in the calculations for the EMA:
Multiplier formula: (2 / [time periods + 1]) = (2 / [10 + 1])
In order to work out the EMA itself, you will also need to call upon a whole host of other data, including the previous day’s EMA. The good news is that you don’t have to carry out any of these calculations yourself – though it’s always useful to have a general understanding of the math behind them. You can apply SMA and EMA to your charts easily and quickly on Nadex, by opening up the list of indicators and selecting moving average (this will apply the SMA) or exponential moving average (this will apply the EMA).
Simple vs exponential moving averages
So, which moving average is best? SMA or EMA? Both will be successfully applied in different situations, so here is a summary of each one to help you decide:
| Summary | When to use | What to bear in mind | |
| SMA | The slower-moving average, usually used to confirm a trend rather than predict it. | Good for longer-term trades. Can also be used to calculate EMA – though charts can do this for you. | The slow pace could mean missing a good trade entry point if you rely on SMA alone. |
| EMA | A faster-moving average that places more emphasis on recent price data. | Good for short-term trades where the most current price data is the most relevant. | The average is very reactive to new prices, so you could read too much into price spikes – they might not be part of a trend. |
SMA and EMA trading examples
Below is an example of combining the longer-term trend defining SMA with a shorter-term EMA to spot potential changes in trend.
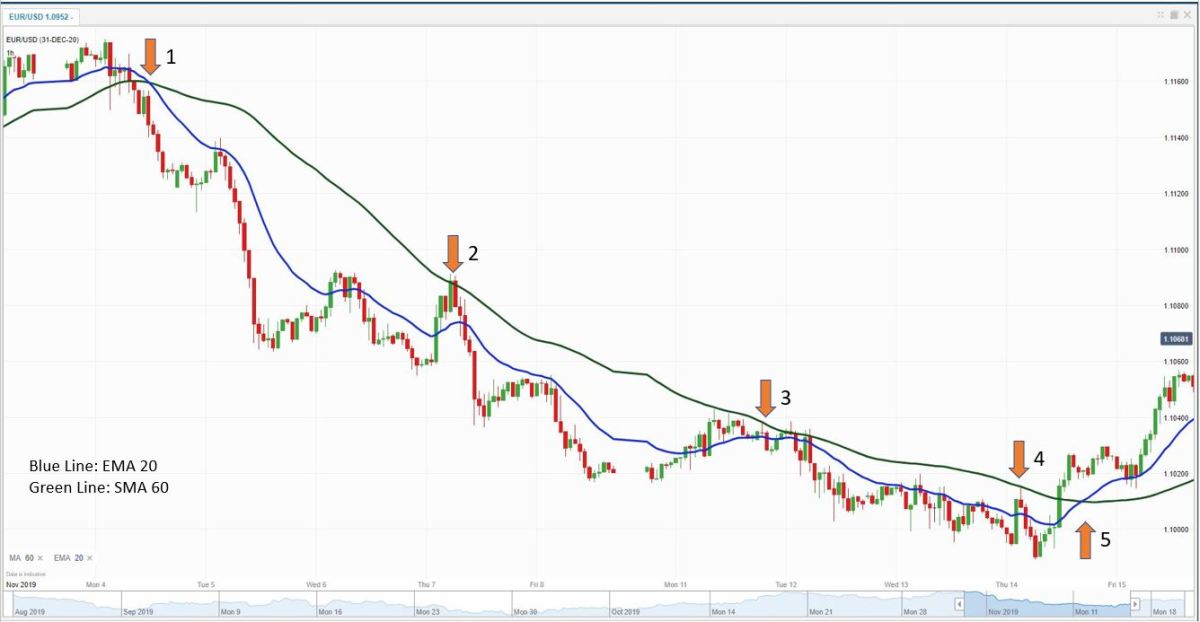
In the chart above, there are two moving averages:
Green Line: 60 period SMA
Blue Line: 20 period EMA
This strategy is called a Moving Average Crossover. The SMA is used to identify the longer-term trend and potential areas of support or resistance, while the shorter-term EMA, also called the signal line, will be used to identify potential changes in the trend for buying or selling opportunities.
Starting in the upper left and following along with the numbers above:
Point 1: We see the more sensitive EMA cross under the longer-term SMA signaling a potential change from an uptrend to a downtrend. This would be a place where a trader may look to execute a sell order to establish a short position.
Points 2, 3 and 4: As the market drops, we look to the longer-term SMA as an indication of potential resistance from prices climbing higher and the downtrend continuing. As you can see there were multiple times where price rose up, touched the 60 period SMA, but could not break through and was pushed lower.
Point 5: Price finally breaks through and the next candles close above the SMA. Shortly after, the EMA crosses above the SMA signaling a potential change from a downtrend to an uptrend. In this area, traders would exit their sell positions and may choose to reverse with a buy order to establish a long position.
Key takeaways
SMA and EMA are useful for traders when establishing a trend and working out entry points. Both have their own strengths and can be used alongside other technical indicators to give traders a clearer picture.
The two main things to remember are:
SMA = simple moving average. It is most useful as a long-term indicator.
EMA = exponential moving average. It is most useful as an indicator where short-term price movement is more relevant.