 Back to Help
 What is a candlestick? How to read candlestick charts
Candlesticks provide a visual representation of price movements, summarizing important information a trader needs to know in one single bar. They are widely used because they show so much information in a very simple format, and it’s easy for traders to spot patterns that can help them make decisions on the markets.
Find out more about candlestick charts, what they are, how to read them, and how to use them to become a better trader.
What is a candlestick?
A candlestick is a single bar on a candlestick price chart, showing traders market movements at a glance. Each candlestick shows the open price, low price, high price, and close price of a market for a particular period of time. Patterns emerging on candlestick charts can help traders to predict market movements using technical analysis.
You might also hear candlesticks being referred to as Japanese candlesticks because they were first used in Japan in the 18th century. They were developed more than 100 years before the bar chart was invented in the West! Candlestick charts were thought to have been first used by Munehisa Homma, a Japanese rice trader, and have developed over time into highly useful tools for traders of all levels.
Candlestick charts can be set to different time periods depending on what is most useful for the trader. They are available with durations from one minute (meaning a new candle will form every minute) through to one month. Short-term traders will tend to focus on the lower time frame candlesticks when they are looking for a trade entry.
Understanding candlestick components
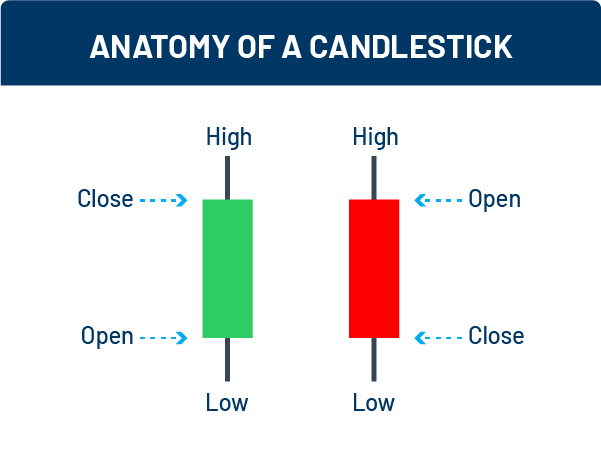
In the default setting, most candlesticks consist of a red or green body; however, on the Nadex platform, these colors can be configured to match each trader’s visual preference. In addition to the body of the candlestick, there is often an upper and lower shadow. Each part holds a different piece of information.
Green means the market has moved up – the market is bullish over the period of the candlestick
Red means the market has moved down – the market is bearish over the period of the candlestick
The upper shadow (also known as the wick) shows the highest price reached during the period
The lower shadow (also known as the tail) shows the lowest price reached during the period
This is the anatomy of a candlestick:
How to read candlestick charts
By looking at the different elements outlined above, you can see at a glance:
Which direction the market has moved in
Whether the movement was linear – if there is a wick or a tail, this indicates that the movement was non-linear
The opening and closing price
The highest and lowest prices within the time period represented by the candlestick
You can set the time period for your candlestick chart, which will help you read it and interpret it in the most relevant way for your trades. While almost everyone will have their favorite candlestick charts for order execution, most experienced traders will start their week, day or trading session by looking at longer time frames. This is called multi-time frame analysis, and helps traders to see key levels of support, resistance, and the overall trend of the market. An example of this would be a trader who typically trades using a 5-minute candlestick chart, but first looks at a one-hour and 15-minute chart to better understand longer-term market sentiment.
Top 5 candlestick patterns for trading
These are the top 5 candlestick patterns for event contracts trading:
Doji
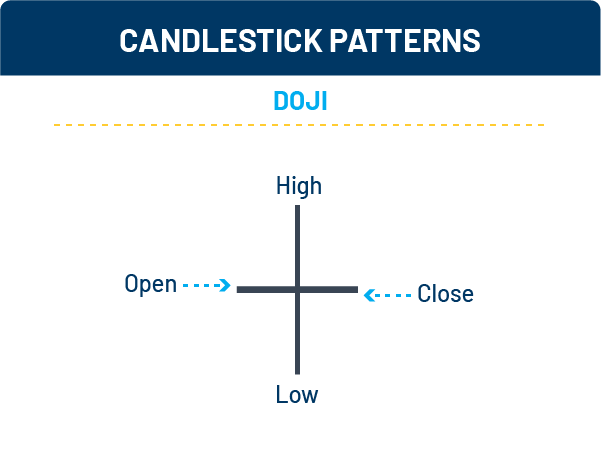
A doji has a very short body, showing that the market opened and closed at a similar level. Dojis often signal market indecision, and if you spot one as a trend is peaking, this could be a signal that it’s about to reverse. You can also choose to use Bollinger Bands® to help here – look out for price action that touches or goes beyond the bands. This could further suggest a trend reversal, helping you decide whether to buy or sell a event contract contract.
Dragonfly and gravestone dojis
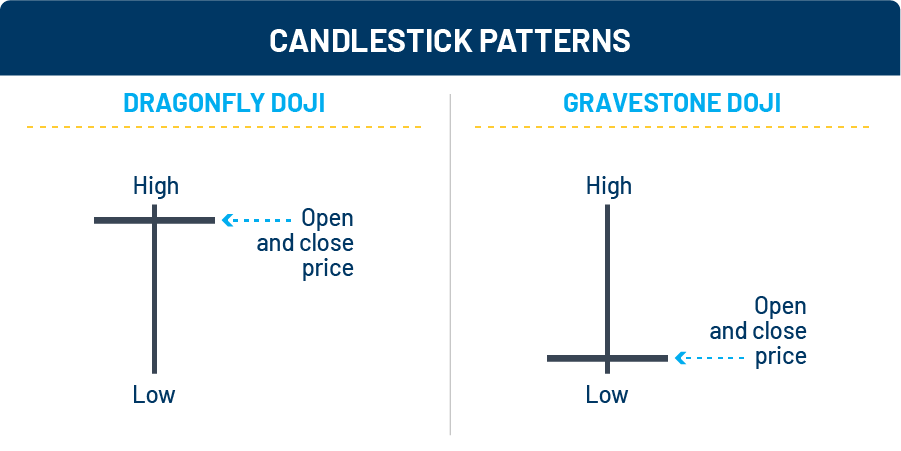
A dragonfly doji is a type of candlestick pattern which is formed when the open, close and high prices are the same, so it will look like a T shape. This suggests that the market could be struggling to continue in the current direction, as the candlestick opened and closed at the same level. Following a downward market move, a dragonfly doji could signal a market turn, with bullish movement ahead. Following an upward market move, it may signal the market is about to turn bearish. In either case, support and resistance lines or indicators could be used as additional confirmation of the pattern and a potential reversal.
A gravestone doji is formed when the open, low and closing prices are all near each other, with a long upper shadow (wick). The price action that leads to the formation of this candle creates a shape like an upside-down T. Similar to the dragonfly doji, a gravestone doji may signal a reversal in the previous trend of the market. Again, try using support and resistance levels or Fibonacci bands to confirm your ideas.
Hammer
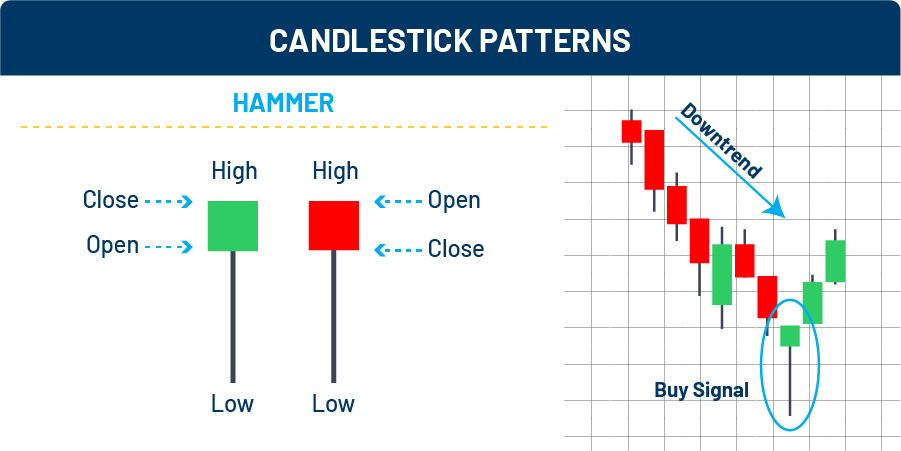
Hammers have long tails that are at least two times as long as the body, and they are seen when a downtrend or price decline is completing. Once again, they can indicate a trend reversal and may signal bullish market sentiment ahead. While it is not mandatory that the candle’s close price is higher than the open price, this is often seen as a stronger signal when the candlestick is bullish.
This candlestick pattern can show selling pressure being exhausted, and buyers preparing to take over. This is because the market moved lower, but couldn’t hold these levels and ended up closing very near where it opened. This could potentially signal a good time to buy a event contract contract.
Hanging man
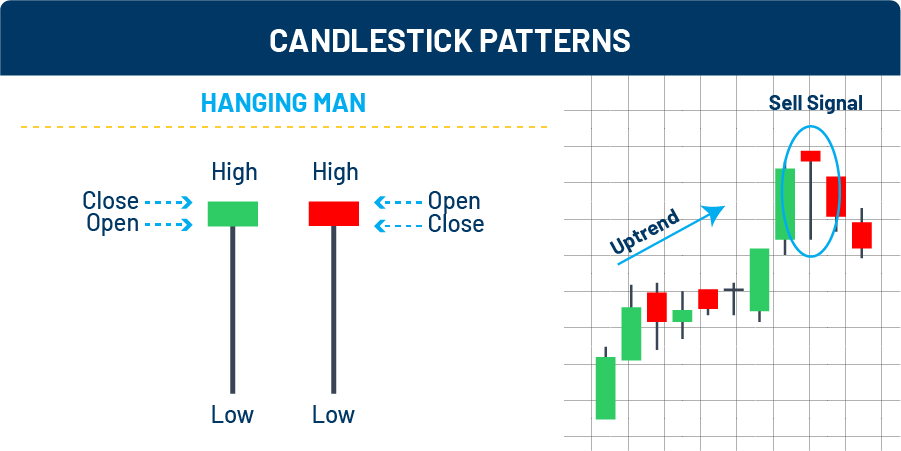
The hanging man uses the same concept as the hammer and actually looks exactly the same, but instead will appear when there is an uptrend. This candlestick pattern will have a very long wick and small body, showing that price action has dropped, then risen again to close near the opening level. It shows that a downtrend could be on the way – a bearish hanging man offers the strongest signal.
Belt hold
A belt hold pattern suggests that a trend may be reversing and indicates investor sentiment may have changed. When looking at them historically, there will often be a clear trend in one direction, followed by a clear trend in the other direction as the color of the candlestick changes.
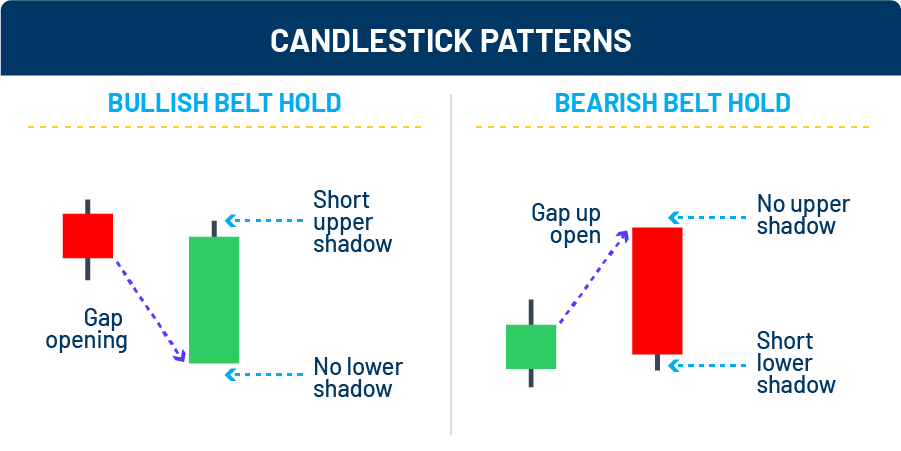
There are two types of belt hold candlestick: one bullish and one bearish.
The bullish belt hold pattern is a signal that a downtrend may be reversing. Often, the bullish belt hold candle’s opening price is substantially lower than the previous candle’s close. This is followed by a rally, where the high price moves to the midpoint of the previous candle, or higher. The period then closes very close to the high mark, leaving only a small wick on top.
The bearish belt hold pattern is a signal that an uptrend may be reversing. It’s the opposite of the bullish belt hold – following an uptrend, this candle will often open higher than the previous candle’s high, followed by a drop to the midpoint of the previous candle or lower. It will close near the low of the period, leaving a small shadow at the bottom of the candle.
If you spot a belt hold early enough, it could give you a clear signal to buy or sell a event contract contract, depending on the direction of the trend. As with all patterns, additional confirmation from subsequent candles or other indicators is advised, especially as the belt hold might not always be reliable on its own.
Key takeaways
Candlesticks are fundamental to traders and show important information at a glance, including:
Market direction
Market opening price
Market closing price
Highest price
Lowest price
You can set candlestick charts to the time period you want depending on the type of trading you are undertaking, and it’s often advisable to look at longer time period first, giving you an idea of the overall trend and key support and resistance levels. Once you’ve carried out your initial analysis, candlesticks can be great tools to alert you to potential changes in the overall trend, alongside other technical indicators to help you confirm your trading decisions.