 Back to Blog
As we switch over to our new trading platform, we’re introducing a better user experience. This includes new and improved charts that are clear, intuitive, and user friendly, helping you analyze the markets and trade your way.
Why use Nadex charts?
When you trade on Nadex, the most relevant charts to use are the ones in our platform. They show you the Nadex indicative price, which is very important to know as there will be slight price differences across various trading providers. Nadex uses a continuously updated average of the most recent prices. This gives an accurate and useful indicative price for markets.
We’ve made our Nadex charts better than ever, with:
A simpler, cleaner user interface
Easy navigation
In-platform education
More customization and better records
Heikin-Ashi candles
Learn more about what we’ve improved and how these changes will enhance your trading experience.
A simpler, cleaner user interface
The first thing you’ll notice is the simpler, cleaner user interface when looking at Nadex charts in our new trading platform. We’ve ensured that all information is presented in a helpful and efficient way, adding to your charts and giving you more information without getting in the way.
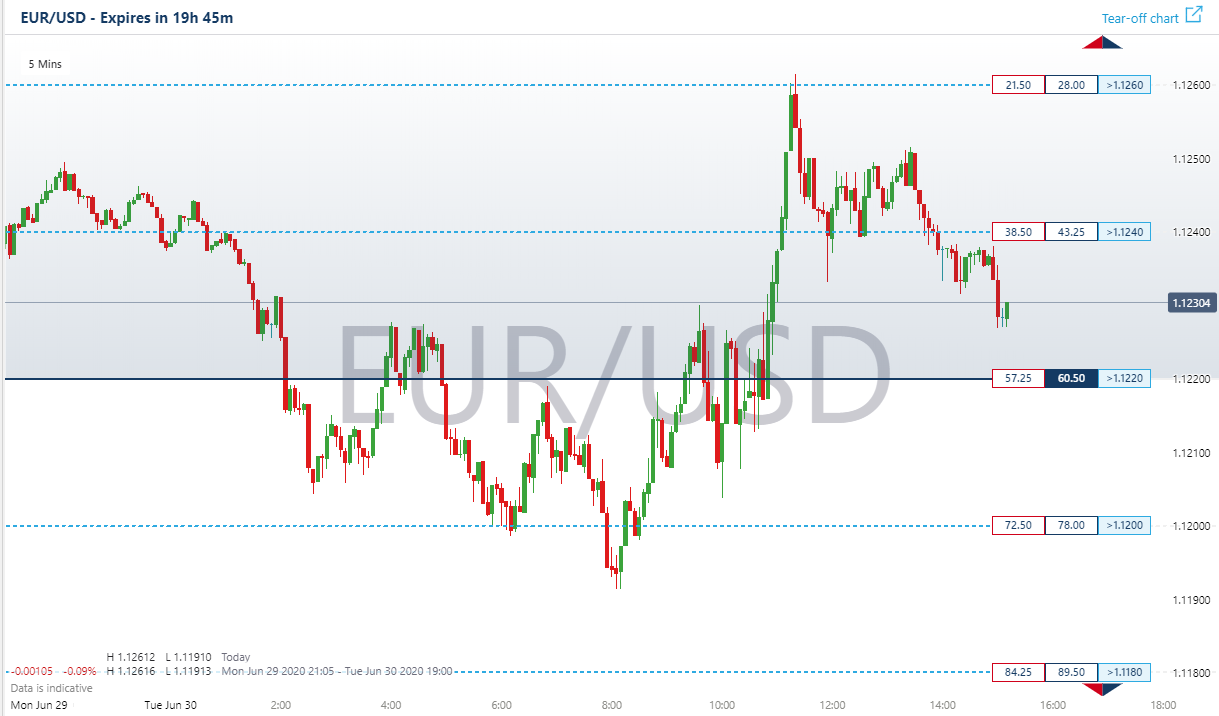
Strike lines have been improved to give you better visibility of the various contracts. When you’ve selected a particular contract, the strike will be shown as a solid line on the chart. Other strikes will be shown with a dotted line, letting you visually compare levels at a glance. The strike, along with the buy and sell prices, is shown on the chart clearly yet unobtrusively – a big improvement on the display offered by our old platform.
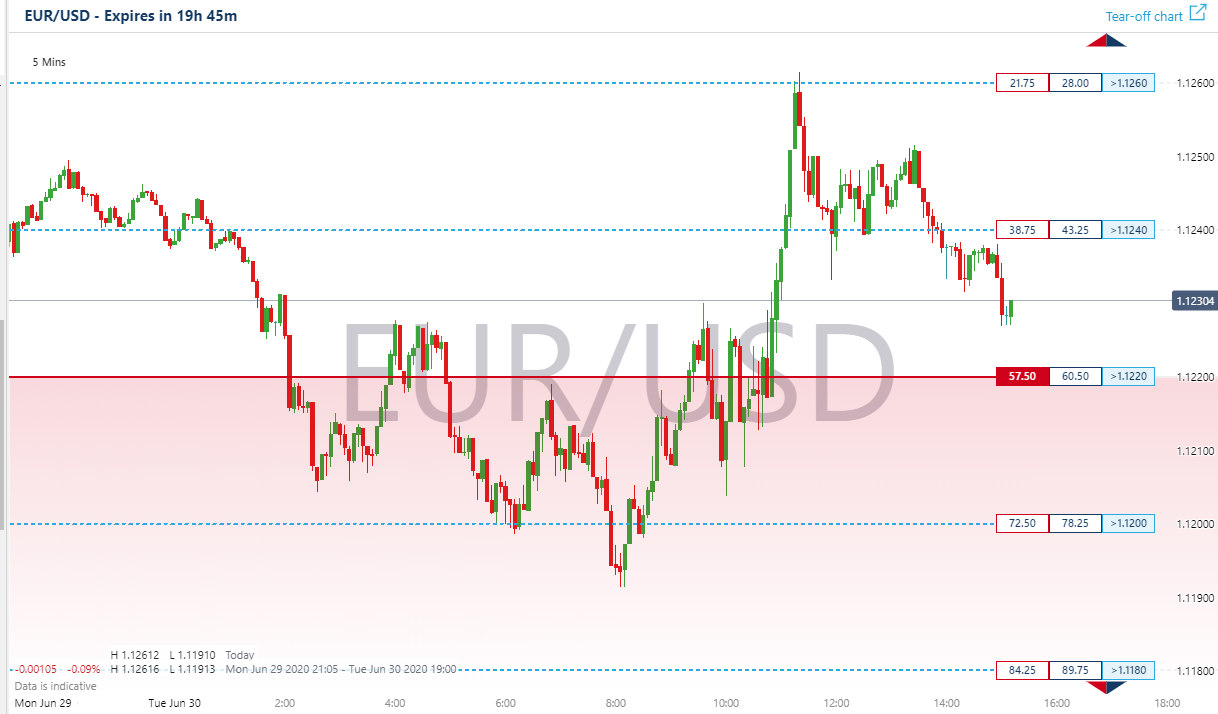
When you choose ‘buy’ or ‘sell’, the chart will be shaded to clearly show the profitable region for that contract.
Here’s an example of how this would look:
Contract type: event contract
Direction: buy
Strike: 1.1220
Market: EUR/USD
Contract type: event contract
Direction: sell
Strike: 1.1220
Market: EUR/USD
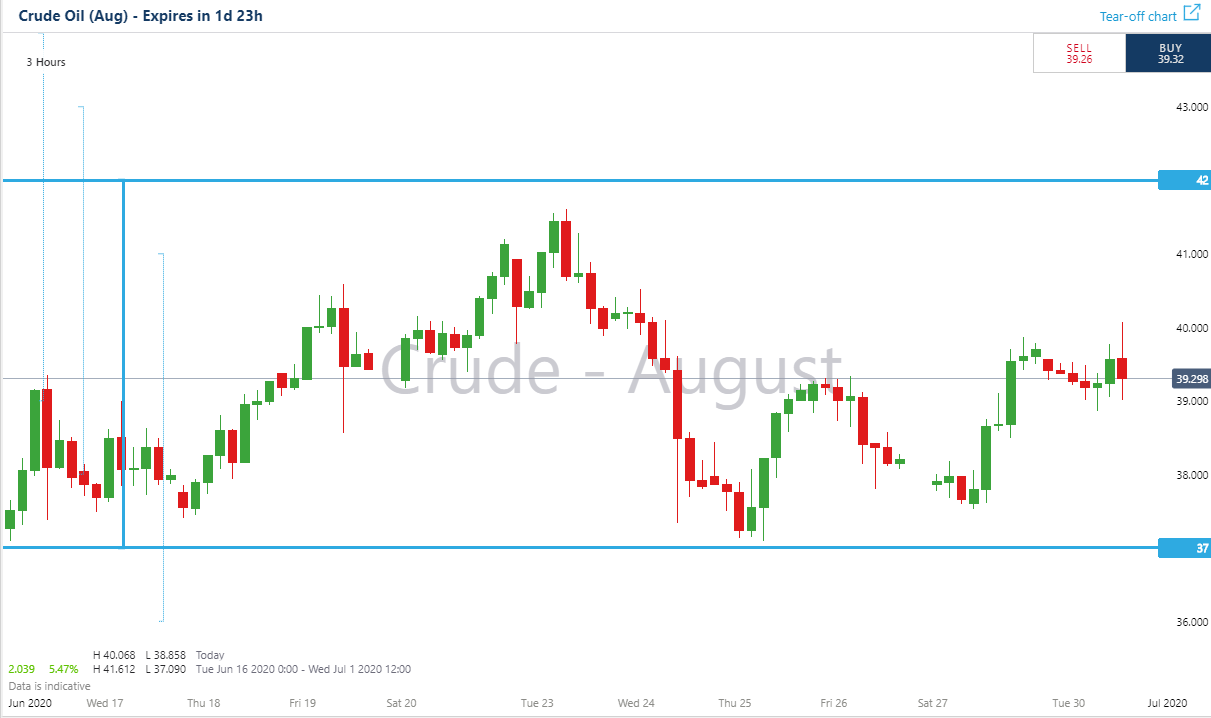
When looking at charts for knock-outs, you’ll be able to see the different ranges for contracts that are available, as well as the floor and ceiling of the contract you’ve selected. This is how it will look, using a crude oil knock-out chart as an example:
Easy navigation
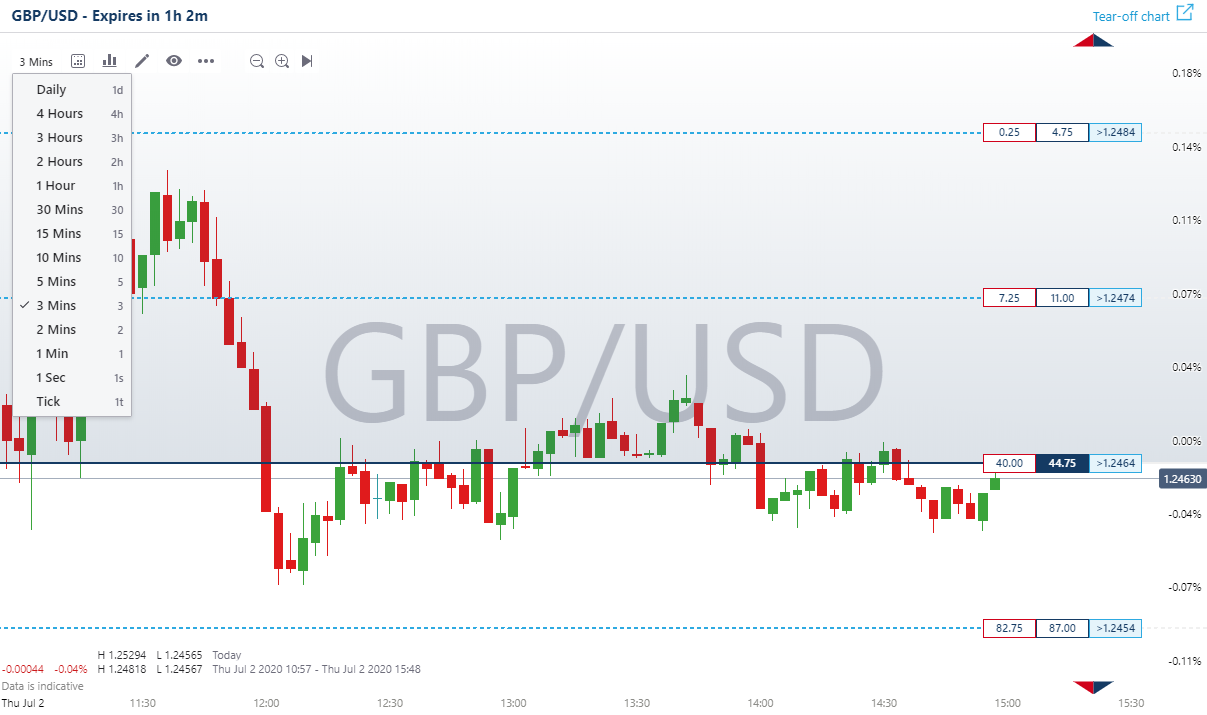
We’ve made it super simple for you to navigate charts in the new platform, with a top navigation bar to select:
Duration
Date range
Indicators
Drawing tools
Chart types
Chart appearance
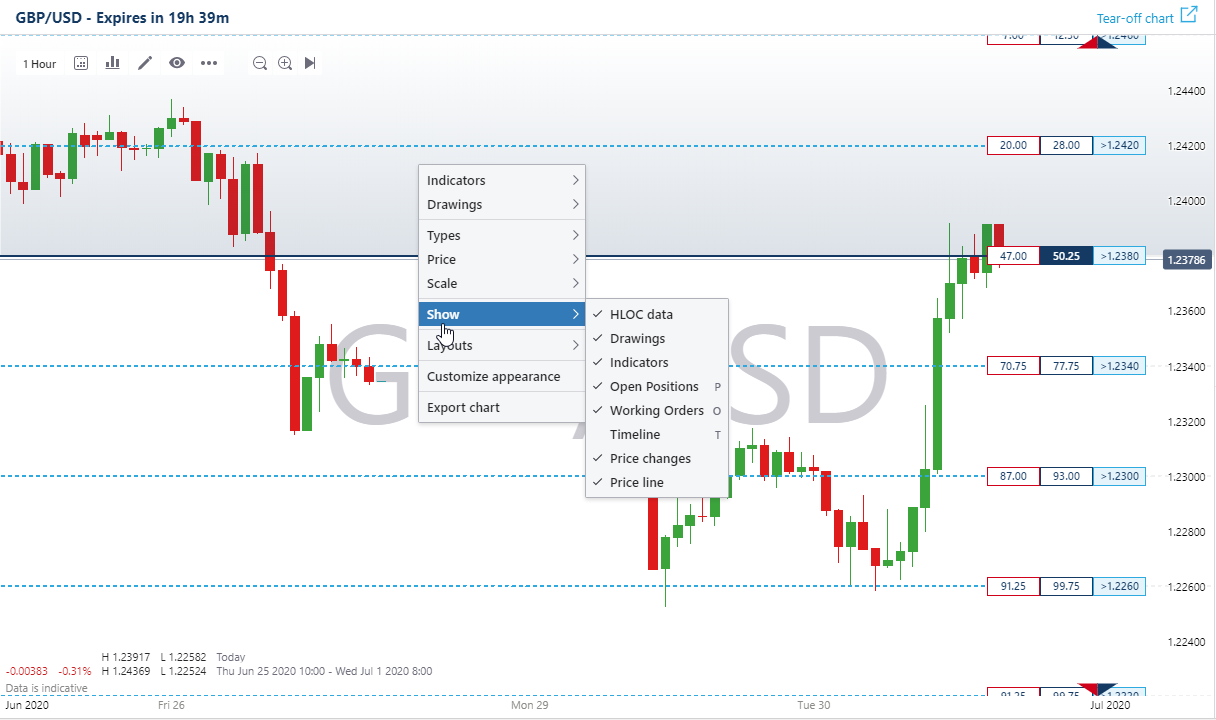
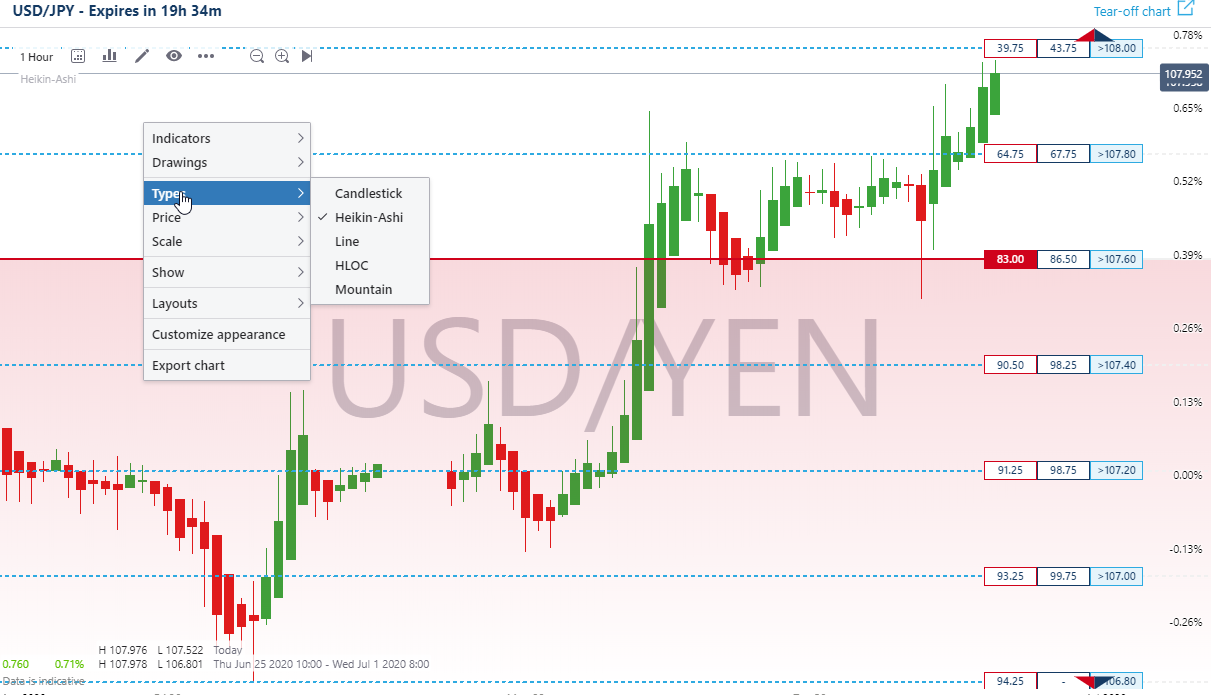
The right mouse button will bring up the same options when using a desktop computer, so you can navigate your way through charts in the way that’s simplest for you.
We’ve also added hot keys to speed up navigation. When you’re viewing a chart, just type a number between one and five to bring up a dialogue box, then use any of the following shortcuts followed by enter:
| One-minute intervals | 1 |
| Five-minute intervals | 5 |
| One-hour intervals | 1h |
| Two-hour intervals | 2h |
| One-day intervals | 1d |
| Show/hide working orders on chart | O |
| Show/hide open positions on chart | P |
| Show/hide timeline on bottom of chart | T |
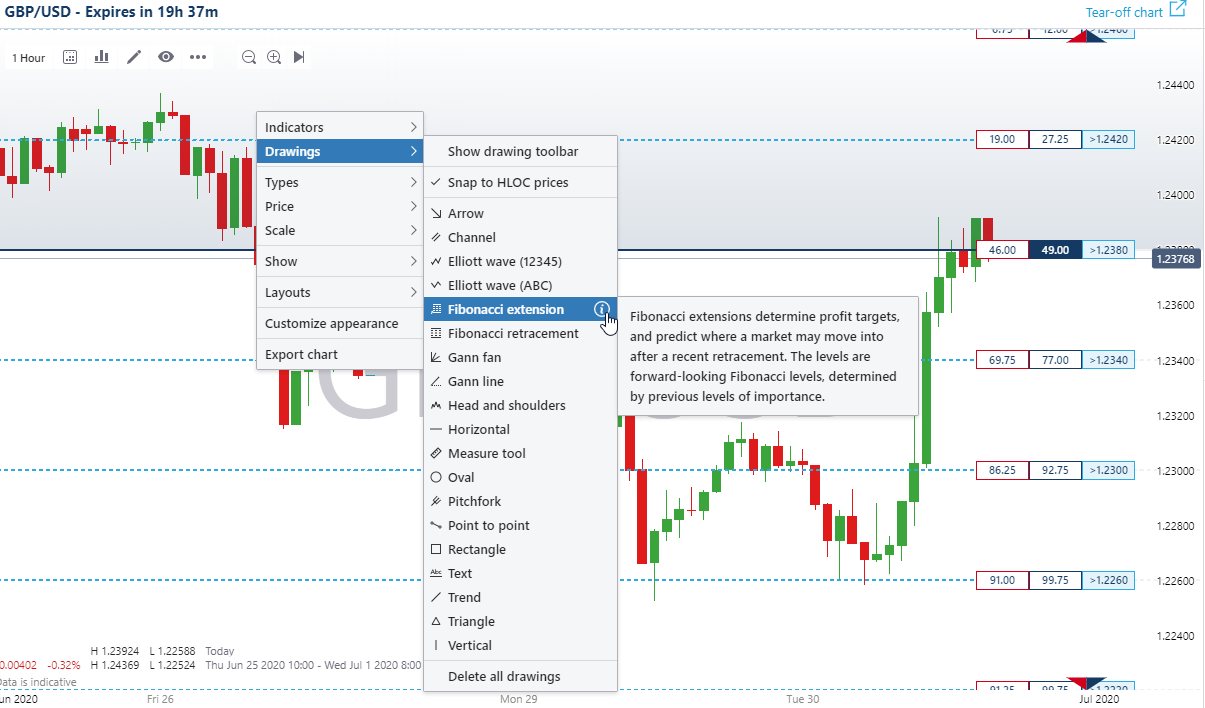
In-platform education
Want to know what a Chaikin volatility indicator is? Wondering how you can use a Fibonacci extension? You can find the answers without even having to leave the platform – inbuilt education gives you a summary of drawing tools and indicators to help you get the most out of Nadex charts.
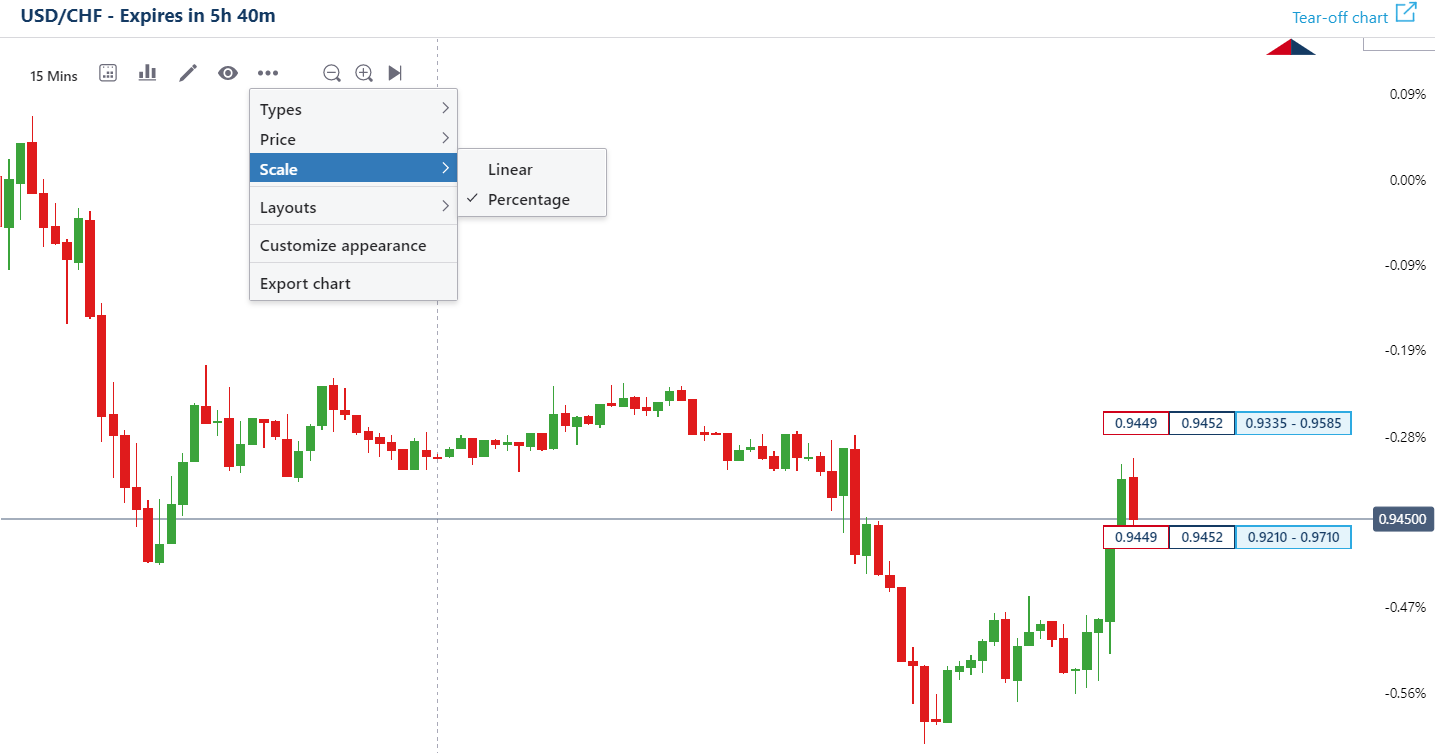
More customization and better records
The Nadex ethos is all about helping you to trade your way and access the resources that are relevant to you.
You’ll have more in-chart customization available, notably the ability to toggle between prices and percentage scales.
You’ll also be able to select Heikin-Ashi candles for your charts – more on that in the next section.
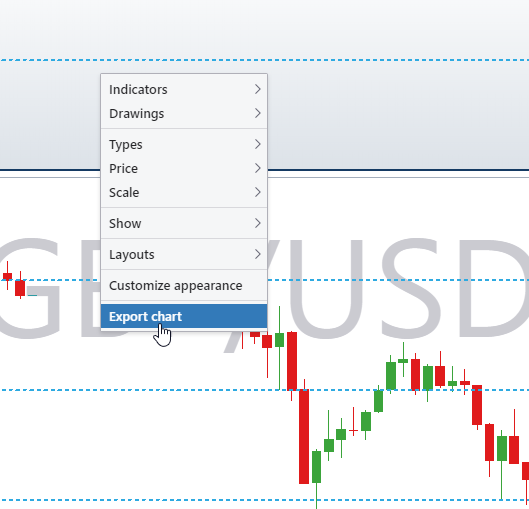
We’ve made it easier for you to keep your own records, too – you’ll be able to export charts, complete with any indicators that you’ve added and notes you’ve made. If you need support from our customer service team, you can share your exported charts with them, allowing you to access the help you need faster and more efficiently.
Heikin-Ashi candles
You can now select Heikin-Ashi candlesticks on your charts, which offer clear readability for your trend analysis.
Heikin-Ashi candlestick charts are in many ways similar to standard candlestick charts, but they use a modified close-open-high-low (COHL) formula.
You can use Heikin-Ashi candlesticks alongside other chart types, helping you to see if trends might persist, pause or reverse. This can help you plan your trades, as well as assisting you to decide whether to keep a position open, or close out early.
Explore our new charts
Take a look at our new charts - log in to the Nadex platform and explore the benefits for yourself.
Don’t have an account yet? Sign up for a Nadex demo account and practice trading with $10,000 in virtual funds.